Max-flow Min-cut and Baseball End-of-Season Elimination
All code used in this article can be found on my GitHub page and is written in Julia using LightGraphs.jl and LightGraphFlows.jl.
Introduction
In the baseball end-of-season elimination problem, we focus on a league of n teams and the goal is to determine which of these teams are mathematically eliminated. When there does not exist any possible scenarios in which a given team can come in first place, or tie for first place, they are said to be eliminated. In this report, we assume all matches happen and none will end in a draw. In some cases, determining if a team is eliminated is trivial. Such as if Team i has less wins and matches remaining than Team j has wins already. In this case, even if Team i wins all of their remaining matches, they will still have less wins than Team j, regardless of outcomes for the remaining matches for Team j. However, not all cases are this simple. Sometimes there exists a scenario where Team i can win more matches than Team j, but this requires Team j to lose all, or most, of their remaining matches, forcing Team k to win enough matches to surpass Team i in the rankings.

Consider the example division standing shown in Example 1. Note the n x n matrix created by the last n rows and columns of a division standings follow certain rules. The diagonal of this matrix must always be zeroes as a team cannot play themselves. This matrix must always be symmetric as Team i playing Team j implies Team j plays Team i. Lastly, the sum of row i cannot be greater than the remaining matches Team i has left as this would be a contradiction. However it can be less than the remaining matches Team i has left as it is possible Team i will play a team from a different division. If we look at Montreal, they have already won 77 matches and have 3 remaining matches therefore they can only win at most 80 matches in total. However, Atlanta has already won 83 matches, therefore Montreal is eliminated. Now if we look at Philadelphia, they have 80 matches and 3 remaining matches. They can win at most at most 83 matches, which ties them with Atlanta. In order for Atlanta to not pass Philadelphia, they must lose all of their remaining matches, however this means New York will win their 6 matches against Atlanta. This gives New York a total of 84 wins, meaning they will surpass Philadelphia in the rankings, therefore Philadelphia is eliminated.
While the previous example is quite simple and can be solved quickly with brute force, this is not always the case, especially in larger examples. To help solve this problem in a more efficient way, we turn to graph theory.
Background
Directed Graphs

In graph theory, a directed graph, or more commonly called a digraph, is the combination of a set of nodes N and a set of edges A, which are directed, such as the one shown. In a digraph, for v₁, v₂ ∈ N, if there exists an edge from v₁ to v₂, denoted v₁v₂, we have v₁v₂ ∈ A. However, as these edges are directed, this does not imply v₂v₁ ∈ A. For a node v ∈ N we denote δ⁺(v) the set of edges going from v to another node in N and δ⁻(v) the set of edges going from another node in N to v. For the example in the above image, we have δ⁺(v₂) = {v₂v₄} and δ⁻(v₂) = {sv₂, v₁v₂}. For each edge e ∈ A, we can assign a weight, denoted xₑ, which can be thought of as the amount of information travelling across an edge from one node to another. There is a more specific type of digraph known as an s-t graph, in which we specify a source node, denoted by s, and a terminal node, denoted by t. In an s-t graph, for any node v ∈ N\{s,t}, the sum of weights in δ⁺(v) is equivalent to the sum of weights in δ⁻(v), however this is not the case for s and t.
Maximum Flow Problem
The flow of an s-t graph can be defined as the difference in information leaving and entering s, or equivalently, the difference in information entering and leaving t. All other nodes must conserve this flow of information, hence the condition specified in our definition of s-t graphs. The goal of the maximum flow problem (MF) is to maximize the flow of an s-t graph by modifying the weights xₑ for each e ∈ A. When for some, or all, e ∈ A, there exists an upper bound, or capacity, denoted uₑ, on each xₑ. We say an edge is saturated if xₑ = uₑ. Combining this objective and these constraints, we can formulate (MF) as

Minimum Cut Problem
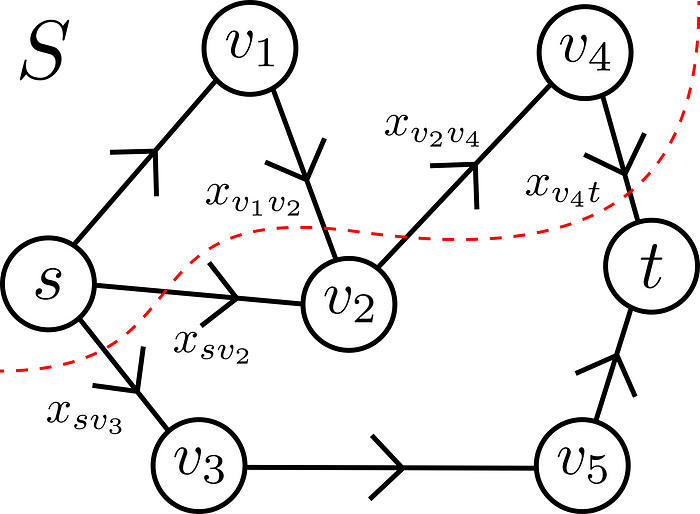
A cut of a graph is a partition of the nodes into two disjoint sets S and T such that S∪T = N. More specifically, in a cut of an s-t graph, we have s ∈ S and t ∈ T. An example of one of these cuts is shown in the image to the left where S = {s, v₁, v₄} and T = {v₂, v₃, v₅, t}. The goal of the minimum cut problem (mC) is to minimize the sum of capacities leaving S by modifying the partition of N into S and T. Combining this objective and constraint, we can formulate (mC) as

The Max-flow Min-cut Theorem
The max-flow min-cut theorem states that given an s-t graph, the optimal values to (MF) and (mC) are equivalent. The optimal solution to (mC) gives us the minimal set of edges, in terms of capacity, in which removing would disconnect s and t. In other words, this is the minimal set of edges such that all information travelling from s to t must move across, therefore any solution to (MF) will saturate these edges. If a solution to (MF) does not saturate these edges, then there either exists a more minimal cut that creates a tighter bottleneck for the flow, which is a contradiction as we have an optimal solution to (mC), or there exists a more maximal flow as the removal of these edges disconnects s and t, which is also a contradiction as we have an optimal solution to (MF).
Methods
In order to relate the previous optimization problems to the original baseball end-of-season elimination problem, we must first define the graphs that will be used. For Team i we define a source node s, a node for each possible match-up between any two teams in the division excluding Team i, which we will call match nodes, a node for each team in the division excluding Team i, which we will call team nodes, and finally a terminal node t. For a division of n teams, this gives us a total of (n² - n + 4) / 2 nodes. Note that we assume n ≥ 3. If n = 2 then determining if a team is eliminated is trivial and does not require this method. Next for each j, k ≠ i we create edges going from s to the match node corresponding to Team j versus Team k with a capacity of the remaining matches between Team j and Team k. Next we create two edges going from the match node corresponding to Team j versus Team k, one to the team node corresponding to Team j and the other to the team node corresponding to Team k with infinite capacity. In this implementation we simply use a constant capacity of 1000 for each of these edges. Lastly we create an edge going from the team node corresponding to Team j to t with a capacity of wᵢ + rᵢ - wⱼ for each team node, where wᵢ is the number of wins Team i has, rᵢ is the number of remaining matches Team i has, and wⱼ is the number of wins Team j has. Note that if this capacity is negative, Team i cannot obtain more wins than Team j currently has and therefore should be eliminated without any further explanation so we need not consider this scenario here. This capacity represents the number of games Team j can win without surpassing Team i in the rankings.
In Julia we can initialize this graph for Team i of n using the DiGraph function in LightGraphs:
# Initialize the DiGraph using LightGraphs
# Source + all possible matches + each team + sink = # of nodes
# Source = node 1, terminal = node (n^2 - n + 4) / 2
flow_graph = LightGraphs.DiGraph((n^2 - n + 4) / 2)#Initialize nxn capacity matrix
capacity_matrix = spzeros(Int, (n^2 - n + 4) / 2, (n^2 - n + 4) / 2)for k in match_nodes
    # Connect the source node to each match node
    # with capacity equal to the number of those matches left.
    LightGraphs.add_edge!(flow_graph, 1, k)
    capacity_matrix[1, k] = matches_left[k]for j in teams_in_match
        # Connect the match nodes to the teams in each match
        # with large enough capacity.
        LightGraphs.add_edge!(flow_graph, k, j)
        capacity_matrix[k, j] = 1000
        LightGraphs.add_edge!(flow_graph, j, (n^2 - n + 4) / 2)
        capacity_matrix[j, (n^2 - n + 4) / 2] = wins[i] + left[i] - wins[j]
    end
end
With this graph defined for Team i we are assuming they will win all of their remaining matches. We can think of s as the source of the matches not involving Team i and the match nodes as distributing the winner of these matches among the teams such that no team acquires more wins than Team i.
Theorem: Team i is not eliminated if and only if the optimal solution to (MF) saturates all edges leaving s.
Proof: Assume Team i is not eliminated. Given the capacities on the edges going to t, this means there exists a way of distributing the winners of each match such that no team wins more matches than Team i. Additionally, this flow must also be maximal as every edge leaving s is saturated. Therefore if Team i is not eliminated, then the optimal solution to (MF) saturates the edges of s.
Alternate Proof: Assume the optimal solution to (MF) does not saturate all edges leaving s. Suppose the edge from s to the node associated to Team j versus Team k is not saturated. Clearly the edges from this node to the team nodes associated to Teams j and k cannot be saturated, therefore the edges from these nodes to t must be saturated. Suppose Teams j and k play each other m more times. This means that (wᵢ + rᵢ - wⱼ) + (wᵢ + rᵢ - wₖ) < m, or in other words, Teams j and k play each other enough times that at least one of them must win more matches than Team i can possibly win. Therefore Team i must be eliminated. □
For simplicity we assumed that it was just two teams that were the reasoning for Team i being eliminated, however this is not always the case. Sometimes we must use all n - 1 other teams to provide this reasoning. Based on the reasoning provided earlier, if an edge from s is not saturated, the two edges from the corresponding team nodes to t must be saturated, i.e. the sum of these capacities for these edges are less than the capacity on the edge from s. In terms of an optimal solution to (mC), this means the match node and corresponding team nodes will be included in S. Similarly for each other edge of s, if the sum of the capacities of the corresponding team nodes not already in S is less than the capacity of this edge from s, they will also be included in S. This means an optimal solution to (mC) gives us the subset of teams causing the elimination of Team i. By the max-flow min-cut theorem, if the optimal solution to (mC) is S = {s} then the optimal solution to (MF) saturates the edges of s, so in this case Team i is not eliminated. In summary, the optimal solution to (mC) tells us if Team i is eliminated or not, and if so, which teams are the reasoning for this elimination. Repeating this for each 1 ≤ i ≤ n tells us whether or not each team in the division should be eliminated.
In Julia, we can determine the teams causing the elimination of Team i using the flow graph and capacity matrix defined earlier. If no teams are found, then Team i is not eliminated.
part1, part2, v = LightGraphsFlows.mincut(flow_graph, 1, n_nodes, capacity_matrix, BoykovKolmogorovAlgorithm())
cut_teams = []
# Check which teams are in part 1 (the source side).
for nodes in part1
    if node == team_node
        cut_teams = [cut_teams; node]
    end
end
Computational Experiments

Consider the previous example shown in Example 1. Clearly Atlanta should not be eliminated as they can win more games than any other team regardless of the outcomes of the other matches. Now we consider Philadelphia and construct their graph, which is shown in the above image, where the nodes are labelled with each team’s number. Based on the results shown in the image below to the left, we see that Philadelphia should be eliminated as the edge from s to one of the match nodes is not saturated. Looking at the results shown in the image to the right, we can see that Atlanta and New York are the reasoning for this.

Similarly to our brute force reasoning before, we can construct a certificate of elimination using their wins and remaining matches against each other.
Philadelphia is eliminated.
Philadelphia can win at most 80 + 3 = 83 matches.
Atlanta and New York have won a combined total of 83 + 78 = 161 matches.
They will play each other 6 more times.
So they will have a combined total of at least 161 + 6 = 167 matches won.
This means on average each team will win 167 / 2 = 83.5 matches.
Therefore one team will win at least 84 matches.
While it’s not as obvious as Atlanta, we can also show that New York should not be eliminated. Constructing a graph for New York and solving the (mC) for it, we get an optimal solution S = {s} with an optimal value of 4. This is equivalent to the optimal solution to (MF) saturating the edges of s which also has an optimal value of 4. Therefore we can find a scenario where New York comes first. New York can win at most 84 matches. If Montreal or Philadelphia win all of their matches they will have 80 or 83 wins respectively, which is acceptable. In either case, Atlanta ends the season with 83 wins, therefore New York would finish in first place. Lastly, as shown before no graph theory is required to show the elimination of Montreal.
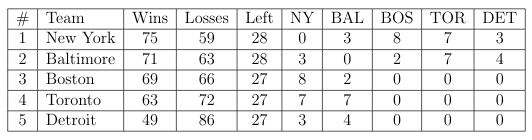
With the previous example solved, we can look at a more complicated problem. Consider the example described in Example 2. Using this method on each team we get that New York, Baltimore, Boston, and Toronto should not be eliminated, while Detroit should be. Constructing the graph for Detroit and using the optimal solution to (mC) for it, we can provide a certificate of elimination.
Detroit is eliminated.
They can win at most 49 + 27 = 76 games.
Boston and New York and Baltimore and Toronto have won a total of 278 games.
They play each other 27 times.
On average, each of the teams in this group wins 305 / 4 = 76.25 games.
Therefore one team will win at least 77 games.
Constructing these graphs for New York, Baltimore, Boston, and Toronto and solving (MF) returns an optimal solution where the all the edges of s are saturated in each case.
Quidditch League Example

With the method validated on some small test examples we want to apply it to a much larger experiment. In this experiment we create a model league loosely based on the British and Irish Quidditch League consisting of the 13 teams: Appleby Arrows, Ballycastle Bats, Caerphilly Catapults, Chudley Cannons, Falmouth Falcons, Holyhead Harpies, Kenmare Kestrels, Montrose Magpies, Pride of Portree, Puddlemere United, Tutshill Tornados, Wigtown Wanderers, and Wimbourne Wasps. In this league, each team plays the other teams twice per season for a total of 156 matches. Normally the ranking for this league is based on the points earned in a match but here we only consider wins and losses as before. Additionally we assume there are no matches played with any teams outside of this league.
Methods
To simulate a season, we start with a n x n matrix A = [aᵢⱼ] for 1 ≤ i, j ≤ n with all diagonal entries aᵢᵢ = 0 and all off diagonal entries aᵢⱼ = 2 for i ≠ j to represent the remaining matches between each team. Next we create a vector z of n random numbers drawn from a uniform distribution between 0 and 1, to represent the skill levels of each team. We randomly select 1 ≤ i, j ≤ n such that aᵢⱼ ≠ 0 to represent a match occurring between Teams i and j. A random number r is drawn from a uniform distribution and if r ≤ zᵢ/(zᵢ + zⱼ) then Team i wins the match, otherwise Team j wins. We then redefine aᵢⱼ := aᵢⱼ - 1. The division standings are then stored in the same format as the division standings in Examples 1 and 2. The process of selecting a match, determining a winner, and storing the new division standing is repeated until all 156 matches are completed.
Using the method described in the previous section, we can sequentially apply it to each of the 156 division standings. Once a team is mathematically eliminated, then by definition they will still be eliminated in the remainder of the league, therefore we need not create a graph for them anymore. As we simulate this league until there are no games remaining, we expect to produce a certificate of elimination for every team that does not finish in first place. Applying this method to each division standing sequentially allows us to get the specific reason and moment a team becomes eliminated.
Results
Montrose Magpies is eliminated after 90 total matches in the season.
They can win at most 2 + 10 = 12 games.
Puddlemere United and Kenmare Kestrels and Caerphilly Catapults and Appleby Arrows and Pride of Portree and Wimbourne Wasps and Wigtown Wanderers have won a total of 63 games.
They play each other 22 times.
On average, each of the teams in this group wins 85 / 7 = 12.14 games.
Therefore one team will win at least 13 games.
Ballycastle Bats is eliminated after 97 total matches in the season.
They can win at most 0 + 13 = 13 games.
Puddlemere United and Kenmare Kestrels and Wigtown Wanderers and Caerphilly Catapults have won a total of 45 games.
They play each other 8 times.
On average, each of the teams in this group wins 53 / 4 = 13.25 games.
Therefore one team will win at least 14 games.
Tutshill Tornados is eliminated after 97 total matches in the season.
They can win at most 5 + 8 = 13 games.
Puddlemere United and Kenmare Kestrels and Wigtown Wanderers and Caerphilly Catapults have won a total of 45 games.
They play each other 8 times.
On average, each of the teams in this group wins 53 / 4 = 13.25 games.
Therefore one team will win at least 14 games.
Chudley Cannons is eliminated after 97 total matches in the season.
They can win at most 4 + 9 = 13 games.
Puddlemere United and Kenmare Kestrels and Wigtown Wanderers and Caerphilly Catapults have won a total of 45 games.
They play each other 8 times.
On average, each of the teams in this group wins 53 / 4 = 13.25 games.
Therefore one team will win at least 14 games.
Holyhead Harpies is eliminated after 105 total matches in the season.
They can win at most 10 + 3 = 13 games.
Puddlemere United and Kenmare Kestrels and Wigtown Wanderers and Caerphilly Catapults have won a total of 49 games.
They play each other 7 times.
On average, each of the teams in this group wins 56 / 4 = 14.0 games.
Therefore one team will win at least 14 games.
Appleby Arrows is eliminated after 122 total matches in the season.
They can win at most 11 + 3 = 14 games.
Puddlemere United and Kenmare Kestrels and Wigtown Wanderers have won a total of 39 games.
They play each other 4 times.
On average, each of the teams in this group wins 43 / 3 = 14.33 games.
Therefore one team will win at least 15 games.
Falmouth Falcons is eliminated after 130 total matches in the season.
They can win at most 11 + 4 = 15 games.
Caerphilly Catapults has already won 16 games.
Wimbourne Wasps is eliminated after 135 total matches in the season.
They can win at most 11 + 5 = 16 games.
Caerphilly Catapults has already won 17 games.
Kenmare Kestrels is eliminated after 140 total matches in the season.
They can win at most 16 + 1 = 17 games.
Caerphilly Catapults has already won 18 games.
Wigtown Wanderers is eliminated after 140 total matches in the season.
They can win at most 15 + 2 = 17 games.
Caerphilly Catapults has already won 18 games.
Puddlemere United is eliminated after 140 total matches in the season.
They can win at most 13 + 4 = 17 games.
Caerphilly Catapults has already won 18 games.
Pride of Portree is eliminated after 142 total matches in the season.
They can win at most 13 + 4 = 17 games.
Caerphilly Catapults has already won 18 games.
